Analyzing Company's Sales Performance
2021, Dec 13
- Designed a data warehouse for the company in the retail industry to deliver advice on sales channels, benefits for old employees and total contribution for each country to drive sales growth
- Utilized SQL to calculate the average number of orders for each employee, the total sales for new & old employees and their correlations
- Established 6 Tableau dashboards to present key findings including product performance to the company’s senior stakeholders and summarized adjustment of strategic decisions in the coming year
Data Profiles
- This is a data warehouse that contains 16 columns of different attributes. It aims to provide detailed information on the order information. The data warehouse aggregates information from 6 different tables: orders, customers, shippers, employees, order_details, and products.
- It includes product information (num_product, subtotal, freight), shipping information (shipped_day, ordered_day, prepare_day, shipper_id, shipped_company), employee information (employee_id, full_name, employee_category), and customer information (customer_id, cus_value, cus_company, cus_country) for each order.
Insights
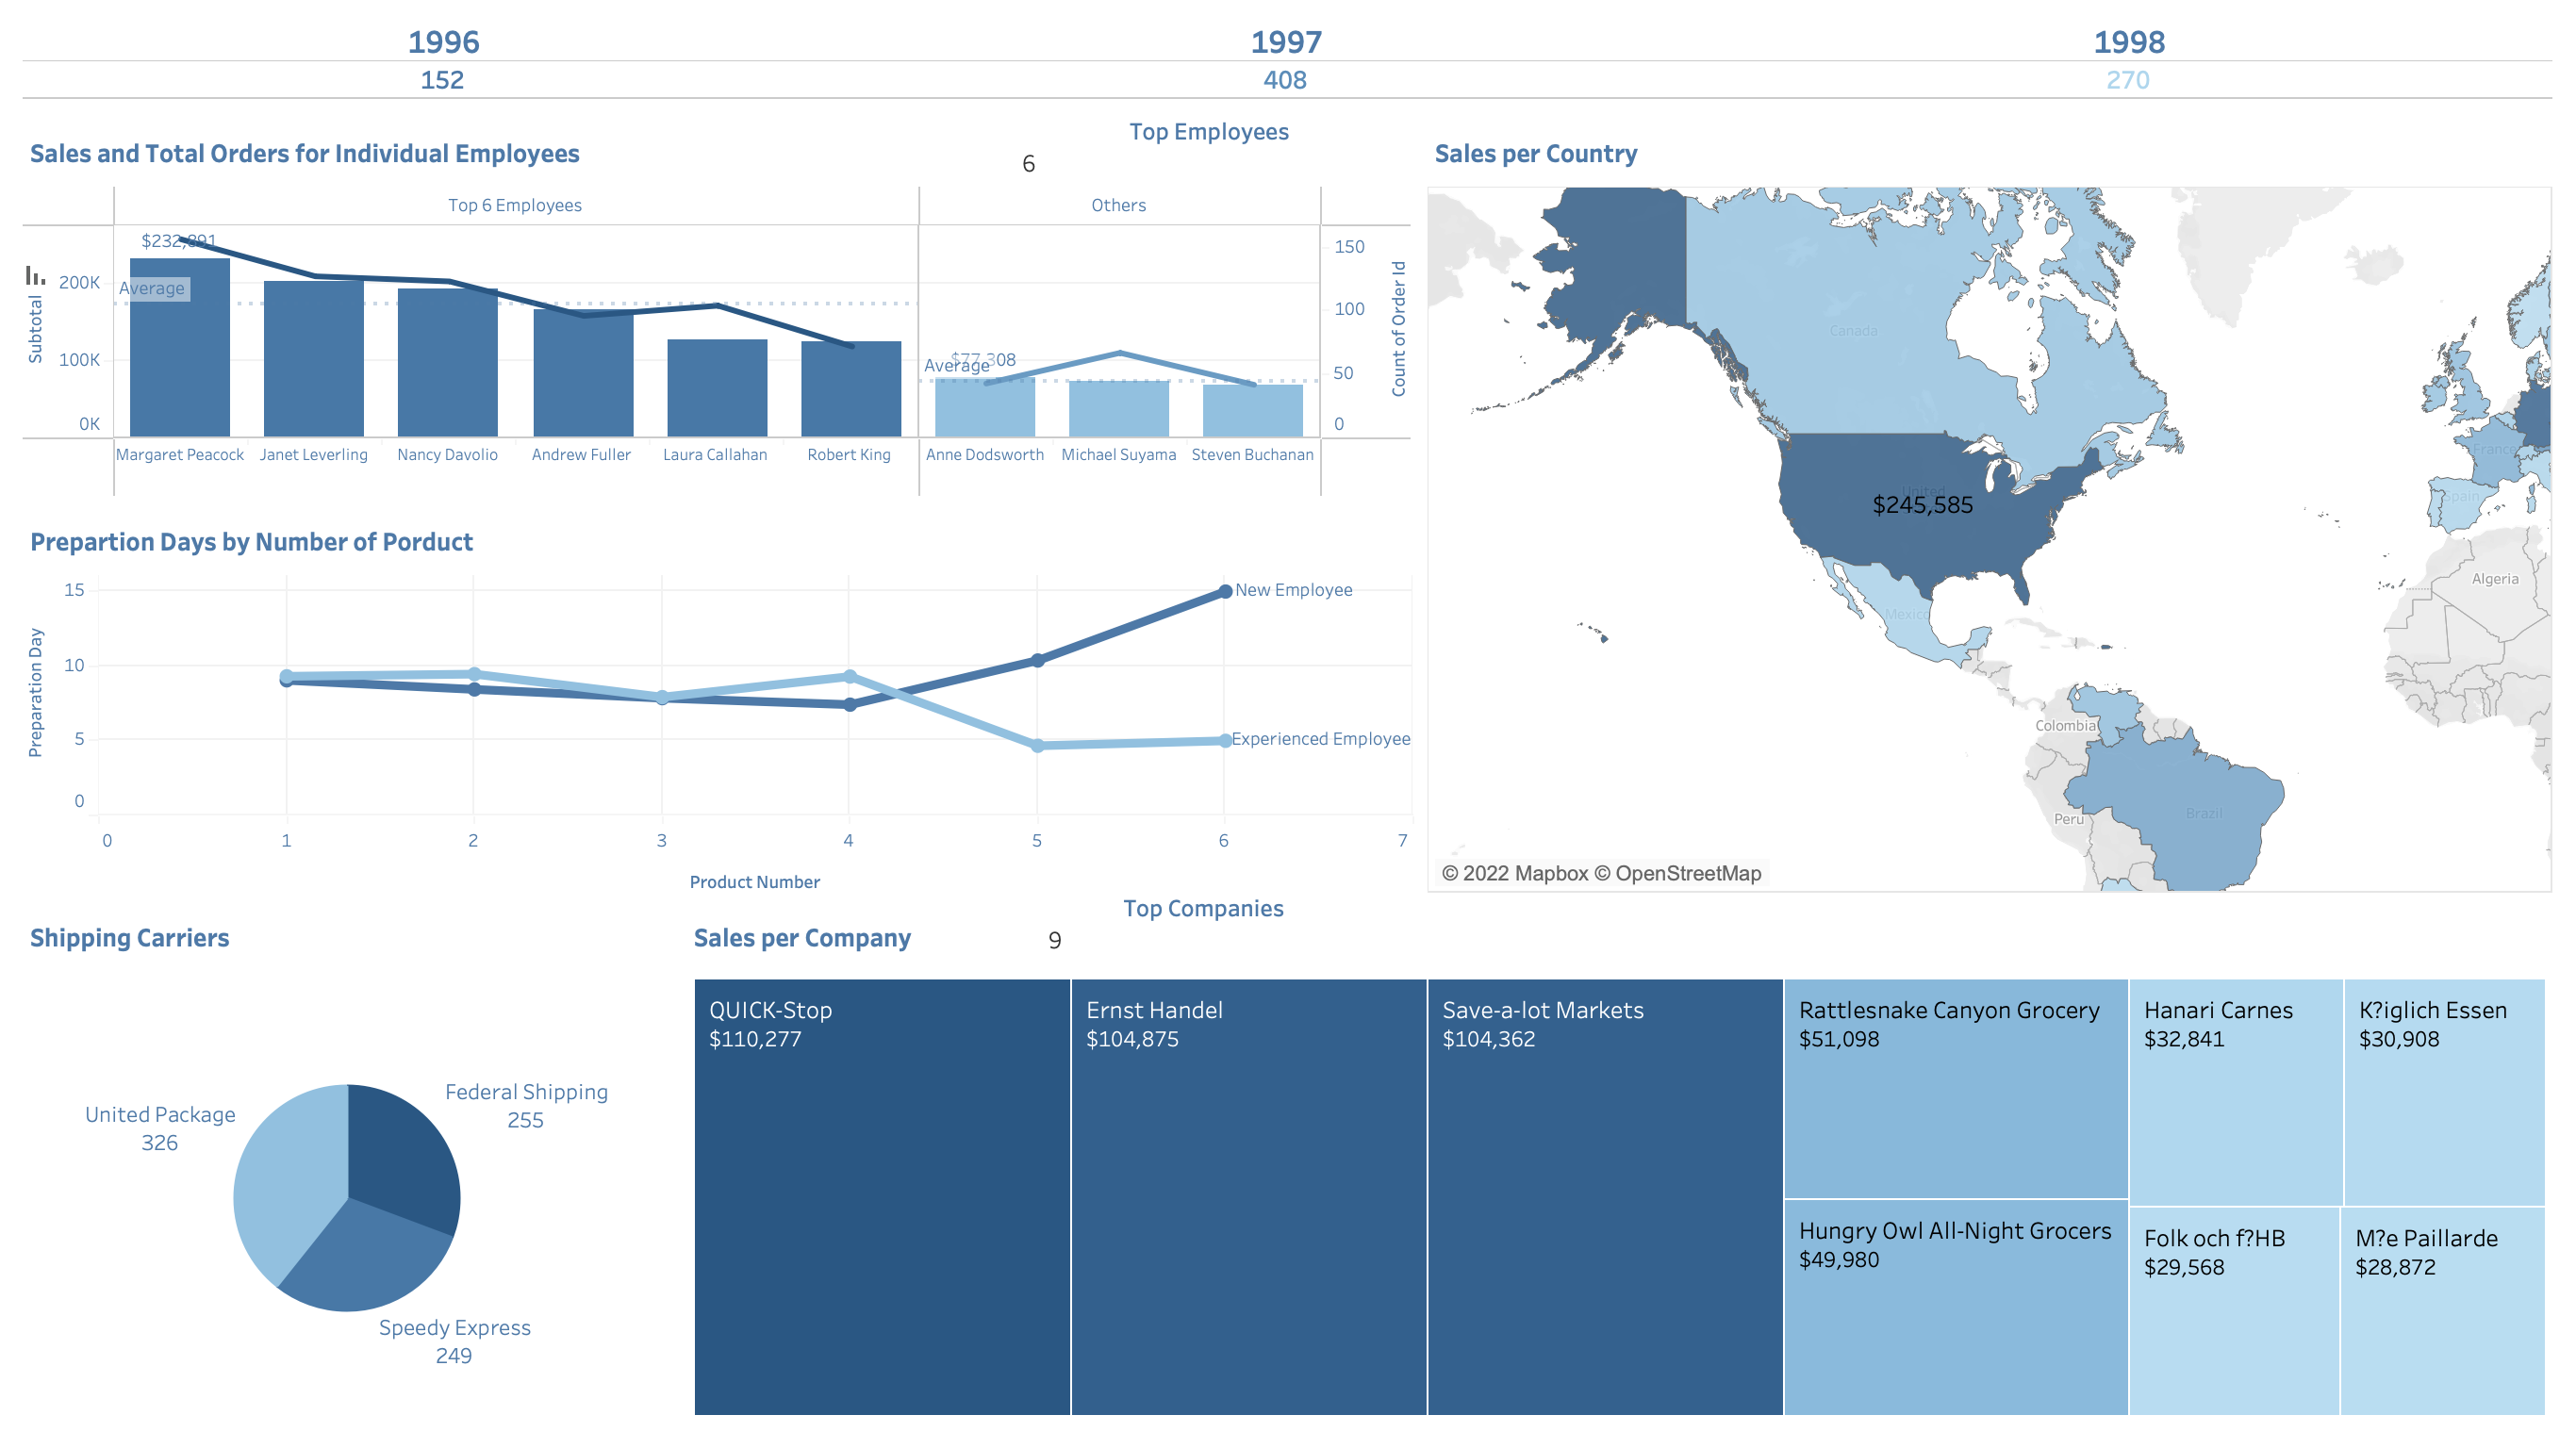
- This is a dashboard used to show the information of a company’s product operating performance from 1996 to 1998. This dashboard was built from three different perspectives: the individual employee sale performance, the company’s overall sale performance, the relationship between preparation time and product quantity, shipping provider, and revenue contribution.
- It provides a view of product operation performance for the company. Management will find these metrics useful to aid in making informed strategic decisions or adjustments in the coming years. Maintaining a picture of performance and sales is vital to the operation of any company, and we believe management would appreciate the descriptive statistics provided in our dashboard.